
Mapping the cancer-specific EORTC QLQ-BR23 onto the preference-based EuroQol-5D instrument
-
Copyright
© 2013 PRO MEDICINA Foundation, Published by PRO MEDICINA Foundation
User License
The journal provides published content under the terms of the Creative Commons 4.0 Attribution-International Non-Commercial Use (CC BY-NC 4.0) license.
Authors
| Name | Affiliation | |
|---|---|---|
Zoltan Voko |
Department of Health Policy & Health Economics, Institute of Economics, Faculty of Social Sciences, Eötvös Loránd UniversitySyreon Research Institute |
|
Renata Nemeth |
Department of Statistics, Faculty of Social Sciences, Eötvös Loránd University |
|
Magdolna Dank |
Department of Diagnostic Radiology and Oncotherapy, Semmelweis University |
|
Zsófia Nagy-Erdei |
Novartis Ltd |
|
Zoltan Kalo |
Department of Health Policy & Health Economics, Institute of Economics, Faculty of Social Sciences, Eötvös Loránd UniversitySyreon Research Institute |
|
Lajos Geczi |
National Institute of Oncology |
Background: For cost-effectiveness analysis quality of life weights estimated by preference based utility measures are needed. In many studies however, quality of life is estimated by instruments that cannot provide utility measures. The aim of the study was to derive a function which can map the EORTC QLQ-BR23 questionnaire onto the EuroQol-5D (EQ-5D) questionnaire in breast cancer patients.
Methods: A cross sectional study was performed in Hungary in 615 breast cancer patients with different states of the disease. Quality of life was measured by both EORTC QLQ-BR23 and EuroQol-5D. Ordinary stepwise backward least-squares regression was used to develop a mapping function. Adjusted R2, Akaike’s Information Criterion (AIC) and root mean square error (RMSE) were used to assess model performance. The robustness of the models was tested by 10-fold cross-validation and bootstrapping.
Results: The “best fitting” model contained 26 BR23 item levels as predictors selected in a stepwise backward procedure. However, this model showed considerable variability in the selection of predictors. A model, which performed only marginally worse than the “best fitting model” (adjusted R2 0.44, RMSE: 0.216, AIC:-85.8) and contained the BR23 items was much more stable, therefore we considered it as the best mapping function.
Conclusions: The expected value of EQ-5D can be reasonably well predicted based on the results of EORTC QLQ-BR23 in patients with breast cancer. Its applicability, however, for prediction on the individual level is limited.Background
Patient reported outcomes considered important by the researchers, physicians and patients, as well. Therefore, in many research projects not only outcome events, health states are assessed, but the quality of life of patients, too. Quality of life is an important measure in health economic analyses, too. When cost-effectiveness of interventions is compared, the incremental cost corresponding to incremental health gain is estimated. In these analyses health gain is measured by quality adjusted life years (QALYs). To obtain a valid estimate of QALY, one needs a preference based utility measure of quality of life. In many instances ample of data is available on the quality of life of patients with different health states, but usually measured by disease specific instruments which are not capable to provide utility measures. In these cases mapping should be considered as the second-best solution. The advantage of mapping is that it enables outcomes data collected in a study to be used in economic evaluation, even if the main source trial or study did not include a preference based measure [1]. The aim of this study was to develop a function which can map the EORTC QLQ-BR23 questionnaire onto the EuroQol-5D (EQ-5D) questionnaire [2,3].
Methods
Participants, setting
The study was performed in 12 centers specialized in the care of cancer patients in Hungary. The data collection was completed in 11.2009-06.2010. Women were selected according to the treatment modalities. Quotas according to these modalities were given to the centers, and they enrolled the patients consecutively. The primary objective of the study was to estimate the quality of life of patients in different stages of breast cancer. This report presents the results related to the secondary objective, which was mapping EORTC QLQ-BR23 onto EQ-5D. The study was approved by the institutional ethical boards and by the National Ethical Board for Medical Research.
Instruments
All patients were asked to fill-in the EORTC QLQ-BR23 and the EQ-5D questionnaires. The questionnaires were self-administered, but help was provided by the study personals upon request. EQ-5D consists of the EQ-5D descriptive system and the EQ visual analogue scale [2]. We used the former for the analysis. QLQ-BR23 is the breast cancer supplement module of the EORTC QLQ-C30 questionnaire [3].
The EQ-5D descriptive system comprises 5 dimensions: mobility, self-care, usual activities, pain/discomfort and anxiety/depression. Each dimension has 3 levels: no problems, some problems, extreme problems. The respondent indicates which statement in each of the 5 dimensions describes her/his state the most appropriately. A total of 243 possible health states can be defined this way. Utility values were attached to these states in our analysis by the time trade-off (TTO) valuation technique from a UK study [4].
The QLQ-BR23 functional and symptom scores are constructed following EORTC scoring rules. The questionnaire contains 20 four-level questions in five multi-item domains: systemic therapy side effects, arm symptoms, breast symptoms, body image and sexual functioning; and in addition, three single items to assess sexual enjoyment, upset by hair loss and future perspective. The primary result of the scale is the domain specific mean raw scores. These raw scores are then linearly transformed to the final scores of 0-100 scales. Larger values correspond to better quality of life for functional domains (body image, future perspective, sexual functioning, sexual enjoyment), and worse quality of life for symptomatic domains (systemic therapy side effects, arm symptoms, breast symptoms, upset by hair loss) [5].
The questionnaire includes a few filter questions. If the answer to the filter question BR4 (“Have you lost any hair?”) was ’Not at all’, then the upset by hair loss score (BRHL) which is a single-item measure calculated from BR5 (“Were you upset by the loss of your hair?”), was set to 0, its minimum. This recoding was in accordance with the EORTC Scoring Manual.
We used the same technique for the sexual enjoyment score (BRSEE): the score was set to 0 if the filter item BR15 (“To what extent were you sexually active?”) was “Not at all”. The latter recoding is not mentioned in the EORTC Scoring Manual but the technique we used was a straightforward extension of the technique applied for the other screening question. In this way we got valid, interpretable hair loss and sexual enjoyment scores even if the patient had not lost her hair and was not sexually active.
An overall BR23 score (OBR23) was calculated as the sum of the 8 scores. In the calculation of OBR23 the symptom scores were calculated in a reversed way to have the same direction as the functional scores (greater value corresponds to better quality of life). The EORTC Scoring Manual does not recommend using such a global score to measure quality of life, however, from pure statistical considerations, it could be worth using the overall score as predictor in the first simplest regression model serving as a point of reference for more complex models.
Analysis
OLS regression models
The essence of our approach was to explore the relationship between the two instruments by ordinary least-squares (OLS) regression analyses.
We built four regression models using EORTC QLQ-BR23 questions aggregated to different extent as predictors. In each model the dependent variable was the EQ-5D index (the utility value). The individual EQ-5D dimensions were not attempted to be predicted separately, as previous studies showed it to be a less efficient or equally efficient procedure in terms of prediction [6,7].
The predictors of the models were refined step by step, always using a lower level of data aggregation. In the first model the predictor was the calculated QLQ-BR23 overall score. In the next model the predictors were the eight QLQ-BR23 scores. Next the predictors were the 23 QLQ-BR23 items (questions), separately. These models require the assumption that the predictors are measured by an interval scale, i.e. the same difference in a predictor has the same effect on the utility value regardless of the actual value of the predictor. For example in the model with the QLQ-BR23 scores as predictors if a score changes from 20 to 30 it has the same effect on the utility values as changing from 50 to 60 since the difference in the scores is 10. In the next more complex model the four levels of the items were entered as categorical predictors, not assuming this linear trend for the items of a question. Thus, in this case the number of the independent variables was three times the number of questions (because each item has four levels, one of which was the reference category).
If the full models fitted reasonably well, then we looked for more parsimonious models by running stepwise backward regression. We started with the full model and set the removal criterion to p= 0.1 and the re-entry criterion to p=0.05. This means that if a predictor was not significant at the level of 0.1 then it was removed from the model but could re-enter if its significance reached 0.05 after removing other predictors.
OLS regression assumptions were examined by the following methods:
- VIF index was used to test collinearity. Some of the problematic (VIF>10) predictors were removed.
- Nonlinearity in any of the predictors was checked with the help of augmented partial residual plots.
- Normality assumption for regression residuals was checked with plotting the quantiles of the regression residuals against the quantiles of standard normal distribution (Q-Q plot).
- The assumption of the homoscedasticity of the residuals was visually checked with plotting predicted values against standardized residuals since known statistical tests for homoscedasticity are very sensitive to violation of the normality assumption hence they cannot be used if normality assumption fails.
Assessment of goodness-of-fit
Goodness-of-fit and predictive power were measured with the root mean square error (RMSE), the adjusted R2 indices and Akaike’s Information Criterion (AIC). AIC is an information-theoretical model selection criteria with the advantage of applicability to non-nested models. Lower AIC values indicate a better model. The range of the predicted EQ-5D values is also reported since OLS models struggle to produce EQ-5D indices that are negative or equal to 1.
Internal validity
Judging the internal validity of the results is of primary importance when predictive models are built. Since no external dataset is available, within-sample validation was carried out with the help of replication techniques. Two tests were conducted. Firstly, stability of the model coefficients is of interest since the relatively large number of predictors may lead to an overparametrised model. Stability, tendency-to-overfitting was tested using k-fold cross-validation. Secondly, stepwise backward selections were validated with refitting the stepwise-backward model in 200 independent bootstrap samples of the same size as the original model had, using simple random sampling with replacement. The validity, robustness of the selection is described in terms of what percent of the replications retrieve each of the predictors selected in the original model.
The whole analysis was conducted by the software package STATA 10.0 [8].
Results
615 women with breast cancer participated in the study. Table 1 shows the major characteristics of the study population. Patients were roughly equally distributed in the treatment modalities defined study groups as planned. Seventy percent of the tumors were in stage T2 or in T1, approximately 60% had lymph node metastasis and 40% had distant metastasis.
Table 1. Characteristics of the study population
| Characteristics | N (%) |
| age (years) 50 51-60 61-70 >70 |
144 (23.4) 188 (30.5) 177 (28.7) 107 (17.4) |
| T1 stage* T2 stage T3 stage T4 stage |
152 (30.4) 196 (39.2) 50 (10.0) 102 (20.4) |
| Lymph node metastasis | 373 (61.6) |
| Distant metastasis | 231 (38.1) |
| Adjuvant chemotherapy | 76 (12.3) |
| Adjuvant radiotherapy | 85 (13.8) |
| Adjuvant hormone therapy | 93 (15.1) |
| Adjuvant targeted therapy | 83 (13.5) |
| Palliative chemotherapy | 87 (14.1) |
| Palliative radiotherapy | 80 (13.0) |
| Palliative hormone therapy | 93 (15.1) |
| Palliative targeted therapy | 74 (12.0) |
* only 500 patients had tumour (T) classification at the time of questioning
Skip errors and missing data
55 patients should have skipped BR16 but answered it; their answers were recoded to missing. Similarly, 50 patients should have skipped BR5 but answered it; their answers were also recoded to missing.
The number of patients with missing data for one or more questions varied between 0.5% and 8% by score.
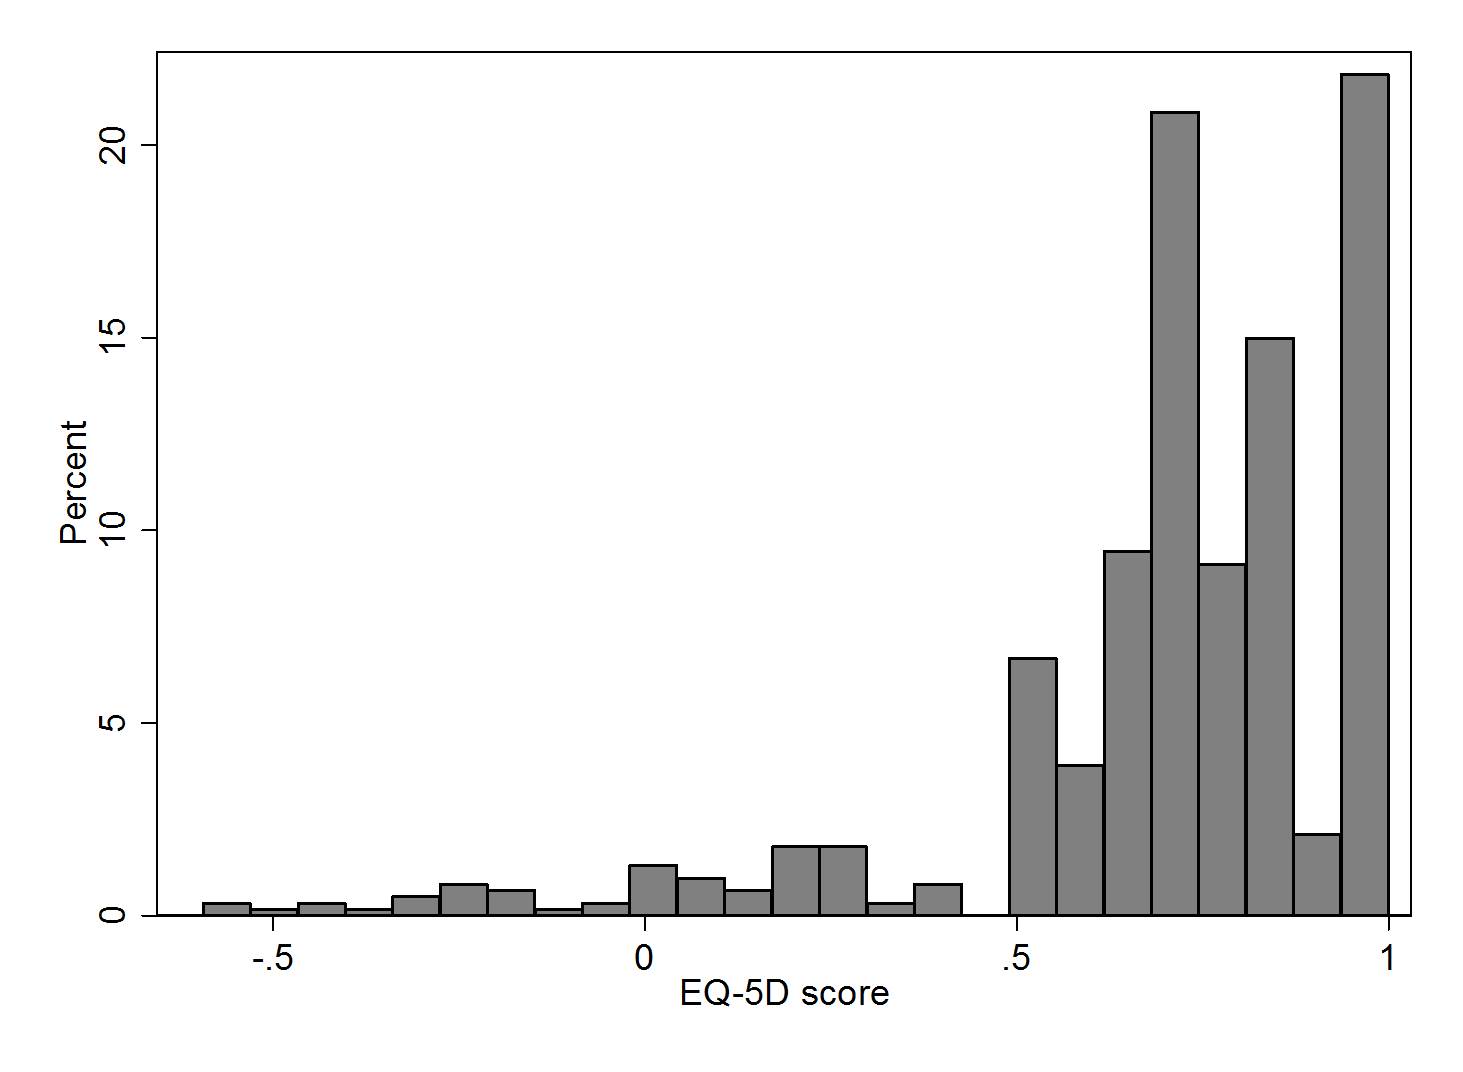
Table 2 presents the summary results of the calculated QLQ-BR23 scores and EQ-5D index. As figure 1 shows, the distribution of the EQ-5D index was heavily skewed with 22% of the indices equal to 1, 89% of the indices above 0.5 and 5% below 0.
Table 2. Summary statistics of QLQ-BR23 scores and EQ-5D index
| N | Mean | SD | Median | |
| BRBI (Body Image) | 615 | 73.62 | 25.05 | 83.33 |
| BRFU (Future Perspective) | 613 | 42.03 | 33.01 | 33.33 |
| BRSEF (Sexual Functioning) | 536 | 13.77 | 21.48 | 0.00 |
| BRSEE (Sexual Enjoyment) | 481 | 13.65 | 25.92 | 0.00 |
| BRST (Systematic Therapy Side Effects) | 614 | 22.97 | 16.10 | 19.05 |
| BRBS (Breast Symptoms) | 615 | 17.02 | 18.48 | 16.67 |
| BRAS (Arm Symptoms) | 615 | 24.95 | 23.30 | 22.22 |
| BRHL (Upset by Hairloss) | 595 | 19.16 | 32.29 | 0.00 |
| OBR23 (Overall BR23 score) | 466 | 454.70 | 113.50 | 462.70 |
| EQ-5D | 614 | 0.70 | 0.29 | 0.73 |
SD: standard deviation
Fulfilment of the model assumptions
Normal quantile plots seemed to indicate that normality assumption did not hold for any of the OLS models. Residual distributions had high kurtosis and were left-skewed basically due to the left-skewness of the EQ-5D distribution. Technically, violation of normality affects the confidence intervals of the parameter estimates and hence the validity of the hypothesis tests, but does not affect the parameter estimates themselves. The confidence intervals of the parameters, however, should be interpreted with caution. Also, residuals were proved to be heteroscedastic in each case, hence regression models and backward selection procedures were run with Huber-White sandwich estimate of the variance.
Overall QLQ-BR23 score (OBR23) regression
Because of missing QLQ-BR23 items, the overall OBR23 could be computed only in 466 patients. The mean EQ-5D value of these patients and of those with missing overall QLQ-BR23 was not significantly different. The overall EQ-5D index was missing in only 2 cases. The model used 465 observations.
The explanatory and predictive power of the model was very poor, with adjusted R2 of 0.195; RMSE of 0.262 and AIC of 75.75. The highest EQ-5D value could appear at almost any level of OBR23, and observations around the mean OBR23 score had very large variance of the EQ-5D value.
QLQ-BR23 component scores regression
Next we regressed EQ-5D on the 8 QLQ-BR23 scores separately. The model used 465 observations. The variance inflation factor (VIF) did not show high collinearity for any of the eight BR23 scores. The OLS regression still did not have very impressive goodness-of-fit statistics with adjusted R2, RMSE and AIC equal to 0.298, 0.245 and 19.528, respectively. Three out of eight scores (body image, sexual enjoyment and breast symptoms) were not significant at the 0.05 level. Symptom scores are expected to have a negative effect on EQ-5D, i.e. the smaller the score the better the quality of life, whereas functional scores are expected to have a positive effect on EQ-5D. Among the predictors upset by hair loss score and sexual enjoyment score had the reverse, wrong sign.
QLQ-BR23 component items regression
By regressing EQ-5D on all BR23 items separately, analysis of VIF suggested collinearity between BR15 and BR16 (Sexual Functioning and Sexual Enjoyment). We have chosen to drop BR16 considering that its derivation is slightly arbitrary (see definition of scores above). Overall, the model resulted in an improved goodness-of-fit with adjusted R2 of 0.4430, RMSE of 0.2157 and AIC of -85.837 (Table 3). A relatively large number of predictors were non-significant. The sign of the parameter estimates were as expected with the exception of BR04 (“Have you lost any hair?”), BR11 (“Did you find it difficult to look at yourself naked?”) and BR18 (“Did you have a swollen arm or hand?”).
The stepwise backward selection left 9 items in the model, namely: BR1, BR4, BR6, BR11, BR13, BR14, BR18, BR19, BR20. Fitting this model using 516 observations yields adjusted R2 equal to 0.4391 and RMSE equal to 0.2141. Compared to the full model, AIC dropped notably from -85.837 to -116.5737. Again, the same predictors (BR04, BR11 and BR18) had regression coefficients with the reverse sign than expected.
Table 3. Coefficients of the full model with QLQ-BR23 component items as predictors
| Coefficient | P-value | 95% CI | ||
| br01 | -0.053 | 0.006 | -0.090 | -0.015 |
| br02 | 0.004 | 0.843 | -0.033 | 0.040 |
| br03 | -0.005 | 0.796 | -0.042 | 0.032 |
| br04 | 0.013 | 0.416 | -0.018 | 0.043 |
| br05* | 0.011 | 0.599 | -0.029 | 0.050 |
| br06 | -0.131 | 0.000 | -0.169 | -0.093 |
| br07 | 0.017 | 0.182 | -0.008 | 0.041 |
| br08 | -0.017 | 0.311 | -0.050 | 0.016 |
| br09 | -0.016 | 0.421 | -0.054 | 0.023 |
| br10 | 0.030 | 0.158 | -0.012 | 0.071 |
| br11 | 0.025 | 0.120 | -0.006 | 0.056 |
| br12 | -0.024 | 0.119 | -0.053 | 0.006 |
| br13 | -0.041 | 0.001 | -0.065 | -0.016 |
| br14 | 0.089 | 0.001 | 0.038 | 0.140 |
| br15 | -0.038 | 0.155 | -0.091 | 0.015 |
| br17 | -0.021 | 0.233 | -0.055 | 0.013 |
| br18 | 0.032 | 0.035 | 0.002 | 0.062 |
| br19 | -0.063 | 0.001 | -0.100 | -0.025 |
| br20 | -0.021 | 0.355 | -0.066 | 0.024 |
| br21 | 0.014 | 0.552 | -0.032 | 0.060 |
| br22 | -0.010 | 0.605 | -0.050 | 0.029 |
| br23 | -0.000 | 0.993 | -0.035 | 0.034 |
| Constant | 1.134 | 0.000 | 1.017 | 1.252 |
CI: confidence interval
* set to 1 if BR04 is ‘Not at all’
QLQ-BR23 component item levels regression
The previous model required the assumption of interval scale QLQ-BR23 items. The assumption could be eliminated by creating a dummy variable for each level of the items. After omitting BR16 because of collinearity with BR15 (see above), this approach resulted in 22×3 = 66 dummy predictors. Compared to the previous model, a large deterioration in goodness-of-fit could be observed, with an adjusted R2 of 0.4619, a RMSE of 0.21194 and an AIC of -62.83772. On the other hand, this was the first model to predict negative EQ-5D values.
Since no collinearity was detected between the dummies by VIF analysis, we fitted OLS regression with stepwise backward selection starting from the full model of 66 dummy predictors, out of which 26 predictors were left. The model was fitted using 492 observations and yielded largely improved goodness-of-fit with adjusted R2, RMSE and AIC of 0.4936, 0.20587 -132.7386, respectively.
Summary of model results
Table 4 summarizes the results of goodness-of-fit for the above models. In terms of explained variance, predictive fit and AIC, the model with BR23 item levels a predictors and stepwise selection performed the best. Predicted EQ-5D range should be judged comparing to the range of the observed data which is (-0.594; 1). Table 4 shows that only three models gave negative predictions, but two of them predicted values significantly above 1, as well.
When deciding which model is the recommended mapping function, results of internal validity tests were also taken into account.
Table 4. Summary results of goodness-of-fit
| Predictor(s) | Selection | N | Adjusted R2 | RMSE | AIC | Predicted EQ-5D range |
| Overall BR23 score | Full | 465 | 0.195 | 0.262 | 75.750 | 0.34; 1.00 |
| BR23 scores | Full | 465 | 0.298 | 0.245 | 19.528 | 0.24; 1.15 |
| BR23 items | Full | 470 | 0.443 | 0.216 | -85.837 | -0.02; 1.05 |
| BR23 items | Stepwise backward | 516 | 0.439 | 0.214 | -116.574 | 0.05; 1.06 |
| BR23 item levels | Full | 470 | 0.462 | 0.212 | -62.838 | -0.21; 1.18 |
| BR23 item levels | Stepwise backward | 492 | 0.494 | 0.206 | -132.739 | -0.21;1.21 |
RMSE: root mean squares error, AIC: Akaike’s Information Criterion
Internal validity, recommended mapping function
In order to test the stability of the stepwise backward selection processwhich yielded it, a bootstrap procedure with 200 replications was applied. 14 of the 26 predictors were retrieved less than 70% of the time, and 7 of them were retrieved less than 50% of the time.
The model with BR23 items as predictors and stepwise selection was the second best model according to AIC. Its bootstrap test showed a similar picture: 4 of the 9 predictors were retrieved less than 70% of the time, and 2 of them were retrieved less than 50% of the time.
The results above seem to indicate strong variability in the selection procedures. This hangs a question mark on the applicability of the two models with stepwise selection. The full models with BR23 items and with item levels as predictors were the best models among the remained ones. The latter was better according to AIC and RMSE, while adjusted R2 preferred the first one. Predictive validity of these two models was tested using 10-fold cross-validation. According to the results, the average increase in RMSE by going from training set predictions to validation set predictions was of significant size (0.025) in case of the model with BR23 item levels as predictors, while it was very small (0.002) in case of the other model.
After all, we favour the full model with BR23 items as predictors for two reasons. Firstly, it performed only marginally worse than the “best fitting” model. Secondly, it was more robust than the others.
Discussion
Our results showed that the expected value of a preference based quality of life measure (EQ-5D) can be reasonably well predicted based on the results of a disease specific quality of life instrument (EORTC QLQ-BR23) in patients with breast cancer. Disease specific instruments generally have the advantage that they are tailored to those aspects of quality of life that are mostly affected by the specific disease, thus they are usually more sensitive to changes in quality of life of patients with the specific disease than the generic instruments. Therefore, these questionnaires are widely used in studies on outcomes in patients with a specific disease. With the use of the mapping function developed in this study it is possible to translate the results of existing and future studies in which the QLQ-BR23 questionnaire is used to the utility scale of EQ-5D, and use these estimates in economic analyses.
There are many studies reporting mapping between EORTC QLQ-C30 onto EQ-5D; most of them applied OLS regression [9-12]. Concerning the heavily skewed sample distribution of EQ-5D, the same pattern was reported by Crott and Briggs in a sample of female patients with locally advanced breast cancer with good baseline health status. The ceiling effect (skewness toward 1 /perfect health/) and the lack of data from the lower region of the scale (below zero) of EQ-5D is often problematic when building a mapping model regressing EQ-5D overall score on any non-preference based instruments [9]. Therefore, the predictive power of the mapping models can be characterized by how much they are capable of giving predicted scores equalling 1 or below 0. Our recommended function performed well in this respect. Nevertheless, OLS has limitations in general to give good predictions in the extreme regions when the outcome variable is so much skewed as EQ-5D index is. A potential statistical alternative could be censored least absolute deviations (CLAD) regression, which has not been widely applied, but showed a better performance than OLS in a study of mapping SF-12 onto EQ-5D [13]. However, it is not self-evident that CLAD performs better than OLS when a disease specific instrument is mapped onto EQ-5D. In a recent publication OLS performed better than CLAD in mapping Western Ontario and McMaster Universities Osteoarthritis Index (WOMAC) onto EQ-5D [14]. A study was published recently, in which EORTC QLQ-30 and EORTC QLQ-BR23 questionnaires were mapped onto EQ-5D [15]. EORTC-30 performed better than EORTC QLQ-BR23. In our view, the results of this study need to be interpreted cautiously, because the authors used only the component scores but not the component items as predictors. Our analysis showed that a mapping function with the component items as independent variables had a much better performance.
Although we tested the robustness of our results by internal validation, it would be a particular interest to externally test the validation of the proposed function in a different series of breast cancer patients before the function is actually used to estimate utility values for economic analysis.
Our study has some limitations. The relatively large mean squares error and low R2 statistics indicate that the model cannot be used to predict EQ-5D index of an individualpatient, just to predict the expected value of a group of patients based on their QLQ-BR23 results. This is generally true for any mapping function, nevertheless in quite a few mapping studies with other instruments higher explained variance was achieved [9].
We used only the specific QLQ-BR23 questionnaire without the general QLQ-C30 questionnaire. BR23 focuses on the specific aspects of breast cancer related to quality of life and does not directly assess the domains which are included in the EQ-5D. This already theoretically limits the possibility to map it onto EQ-5D. Nevertheless, our recommended model still maps QLQ-BR23 onto EQ-5D reasonably well, showing that the specific functional and symptomatic items of QLQ-BR23 largely correlate with the aspects of quality of life assessed by EQ-5D. The sign of all scores except for upset by hair loss and sexual enjoyment were consistent with EQ-5D in the model with scores as predictors. When interpreting this result, one needs to consider that if someone did not experience hair loss, or did not have an active sexual life, then the answer to the question about upset by hair loss and to the question about sexual enjoyment were set to their minimum value (i.e. persons with poor quality of life but not experiencing hair loss and not having active sexual life had a low value of the upset by hair loss and of the sexual enjoyment score). Nevertheless, the behaviour of some predictors (BR23 items) was inconsistent (have the opposite sign than the expected) in the recommended final model, too. These were BR04 (“Have you lost any hair?”), BR11 (“Did you find it difficult to look at yourself naked?”) and BR18 (“Did you have a swollen arm or hand?”).
We used UK tariff valuation of EQ-5D. Recent studies affirmed differences in health-related preferences between countries, indicating the necessity of the estimation of national tariffs [16, 17]. Unfortunately, Hungarian tariff values of EQ-5D are not available. Similarly, preferences of patients with breast cancer might differ by countries, which may restrict the applicability of the mapping function we developed.
Conclusions
We developed a mapping function of QLQ-BR23 onto EQ-5D which is capable to estimate the expected value of EQ-5D utility value in a group of patients with breast cancer conditional on the answers given to QLQ-BR23 questionnaire.
Acknowledgements
We are grateful to the patients who participated in the study and the physicians and nurses in the centers who organized and performed the field work. We gratefully acknowledge financial support of Novartis Hungary and Sandoz Hungary. Participating centers (principal investigators): Department of Diagnostic Radiology and Oncotherapy, Semmelweis University, Budapest (Magdolna Dank); Department of Oncotherapy, University of Szeged, Faculty of Medicine, Szeged (László Thurzó); National Institute of Oncology, Budapest (Lajos Géczi); Department of Clinical Oncology, University of Debrecen, Debrecen (János Szántó); Uzsoki Street Hospital, Budapest (László Landherr); András Jósa County Hospital, Nyíregyháza (József Erfán); Lajos Markusovszky Hospital, Szombathely (András Csejtei); Zala County Hospital, Zalaegerszeg, (Ágnes Ruzsa); Pándy Kálmán Békés County Hospital, Gyula (Béla Pikó); 3rd Department of Internal Medicine, Semmelweis University, Budapest (Éva Katalin Tóth); Bács-Kiskun County Hospital, Kecskemét (Gábor Pajkos); Borsod-Abaúj-Zemplén County Hospital, Miskolc (László Tóth, László Marázi)
- Louise Longworth L., Rowen D. NICE DSU technical support document 10: the use of mapping methods to estimate health state utility values. 2011. Available from http://www.nicedsu.org.uk/TSD 10 mapping FINAL.pdf; [Acessed: 06.06.2013]
- EuroQol Group. EuroQol-a new facility for the measurement of health-related quality of life. Health Policy 1990; 16: 199-208
- Sprangers MA,, Groenvold M,, Arraras JI. et al. The European Organization for Research and Treatment of Cancer breast cancer-specific quality-of-life questionnaire module: first results from a three-country field study. J Clin Oncol 1996; 14: 2756-2768
- The MHV Group. The measurement and valuation of health: Final report on the modeling of valuation tariffs. Centre for Health Economics, University of York; York 1995
- Fayers PM., Aaronson NK., Bjordal K., Groenvold M., Curran D., Bottomley A., on behalf of the EORTC Quality of Life Group. EORTC QLQ-C30 Scoring Manual (3rd edition). EORTC, Brussels 2001
- Krabbe PF., Peerenboom L., Langenhoff BS., Ruers TJ. Responsiveness of the generic EQ-5D summary measure compared to the disease-specific EORTC QLQ C-30. Qual Life Res 2004; 13: 1247-1253
- McKenzie L., Van der Pol M. Mapping the EORTC QLQ C-30 onto the EQ-5D instrument: the potential to estimate QALY’s without generic preference data. Value Health 2009; 12: 167-171
- StataCorp. Stata Statistical Software: Release 10. StataCorp LP, College Station, TX 2007
- Brazier JE., Yang Y., Tsuchiya A., Rowen DL. A review of studies mapping (or cross walking) non-preference based measures of health to generic preference-based measures. Eur J Health Econ 2009; 11: 215-225
- Crott R., Briggs A. Mapping the QLQ-C30 quality of life cancer questionnaire to EQ-5D patient preferences. Eur J Health Econ 2010; 11: 427-434
- Kontodimopoulos N., Aletras VH., Paliouras D. Mapping the cancer-specific EORTC QLQ-C30 to the preference-based EQ- 5D, SF-6D and 15D instruments. Value Health 2009; 12: 1151-1157
- Kind P. Measuring the quality of life on cancer: an index based on QLQ-C30 [abstract]. J Clinical Oncol 2005; 23(16S): 6013
- Sullivan P., Ghushchyan V. Preference-based EQ-5D index scores for chronic conditions in the United States. Med Decis Making 2006; 26: 410-420
- Xie F., Pullenayegum EM., Li SC., Hopkins R., Thumboo J., Lo NN. Use of a disease-specific instrument in economic evaluations: mapping WOMAC onto the EQ-5D Utility Index. Value Health 2010; 13: 873-878
- Kim EJ., Ko SK., Kang HY. Mapping the cancer-specific EORTC QLQ-C30 and EORTC QLQ-BR23 to the generic EQ-5D in metastatic breast cancer patients. Qual Life Res 2012; 21: 1193-1203
- Lamers LM., McDonnell J., Stalmeier PF., Krabbe PF., Busschbach JJ. The Dutch tariff: results and arguments for an effective design for national EQ-5D valuation studies. Health Econ 2006; 15: 1121-1132
- Luo N., Johnson JA., Shaw JW., Coons SJ. A comparison of the EQ-5D index scores derived from the US and UK population-based scoring functions. Med Decis Making 2007; 27: 321-326